
The History of Gold Prices Over the Last 100 Years
(Category: Market Trends and Analysis)
Gold is often seen as a timeless store of value, but its price has fluctuated significantly over the last century. Understanding these changes—and the historical forces that drove them—can help investors and collectors appreciate gold’s role in global finance and make more informed decisions today.
This article explores how gold has been valued over time, from the gold standard to modern markets.
Gold in the Early 20th Century: The Gold Standard Era
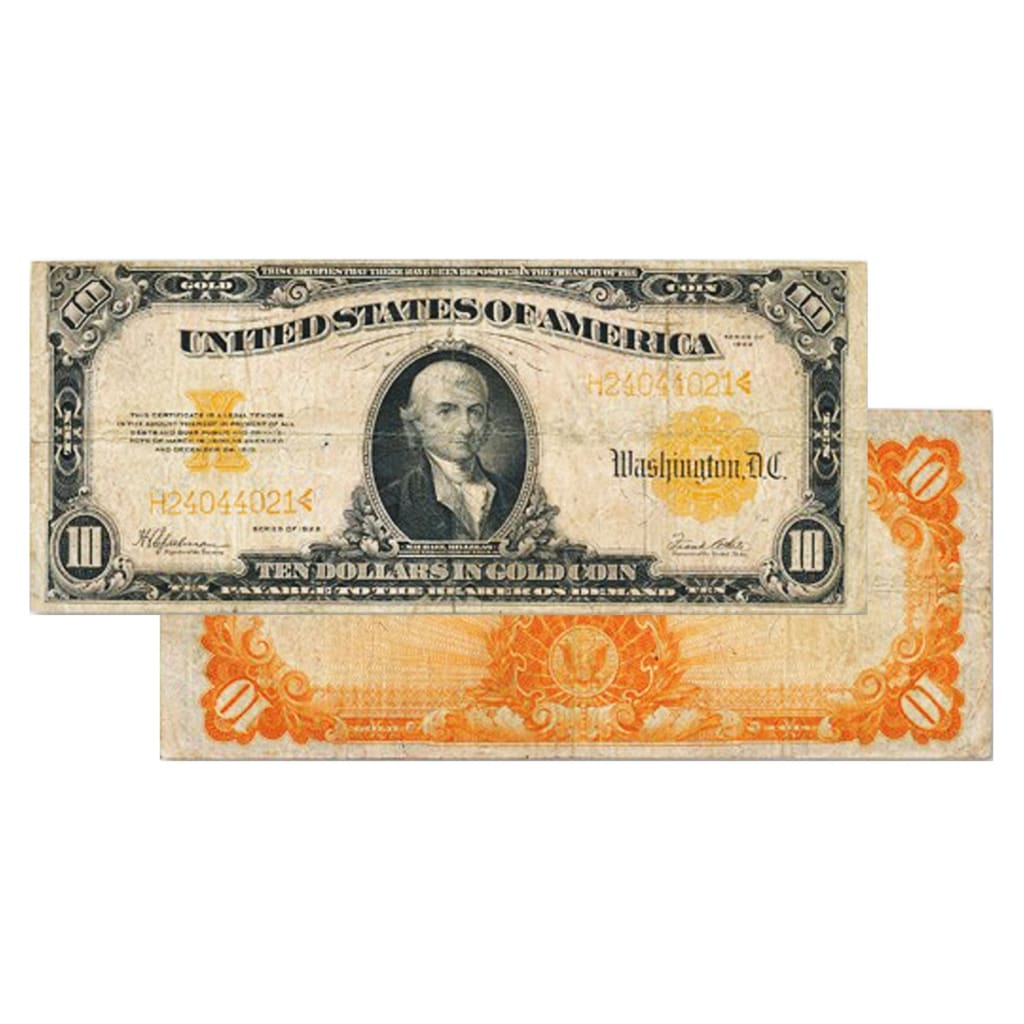
In the early 1900s, gold was pegged at a fixed price through the gold standard, where currencies were directly tied to a set amount of gold.
-
1900s–1933 (U.S.): Gold was fixed at $20.67 per ounce under the Gold Standard Act.
-
1933–1971: President Franklin D. Roosevelt ended gold convertibility for citizens and revalued it to $35/oz to combat the Great Depression.
Under the gold standard, the price of gold remained largely stable—but it also limited economic flexibility for governments during times of crisis.
Breaking the Peg: Bretton Woods and Nixon’s 1971 Shock
After WWII, the Bretton Woods Agreement (1944) pegged world currencies to the U.S. dollar, which was in turn pegged to gold at $35/oz. But growing U.S. deficits and gold outflows led to imbalances.
In 1971, President Nixon “closed the gold window,” ending the dollar’s convertibility to gold and marking the beginning of the modern free-floating gold market.
The Modern Era: Gold Becomes a Market Commodity
Since the 1970s, gold’s price has been determined by market forces.
Notable Price Milestones:
-
1980: Spiked to $850/oz during high inflation and geopolitical tension (Iranian Revolution, Soviet-Afghan War).
-
1999–2001: Hit lows around $250/oz during peak confidence in tech stocks and strong U.S. dollar.
-
2008–2011: Surged past $1,900/oz following the global financial crisis, driven by economic uncertainty and monetary stimulus.
-
2020–2023: Breached $2,000/oz amid COVID-19 pandemic, inflation concerns, and global instability.
Key Drivers of Gold Price Changes
1. Inflation and Currency Weakness
Gold is often used as a hedge against fiat currency debasement. As inflation rises or the dollar weakens, gold tends to gain.
2. Geopolitical and Economic Uncertainty
Wars, pandemics, and financial crises push investors toward gold as a “safe haven” asset.
3. Interest Rates and Fed Policy
Higher interest rates reduce gold’s appeal (since it pays no yield), while loose monetary policy tends to boost its price.
4. Central Bank Demand
When central banks buy gold to diversify reserves, prices often increase due to supply pressure and perception of rising demand.
Gold’s Long-Term Trend: Upward With Volatility
While gold has seen periods of stagnation or decline, its overall trend over the past 100 years has been upward, especially after the 1970s.
-
1920s: ~$20/oz
-
1970s: ~$35 → $850/oz
-
2000s: ~$250 → $1,500+
-
2020s: ~$2,000 and climbing
In inflation-adjusted terms, the real purchasing power of gold has generally preserved wealth over long time horizons—even if short-term fluctuations are sharp.
Final Thoughts
Gold has transitioned from a fixed asset under government control to a globally traded investment responsive to market dynamics. Its history reflects a century of monetary evolution, crisis management, and shifting economic power.
For modern investors, studying gold’s historical pricing offers more than trivia—it provides context for understanding where we are today and where the market may go next.